
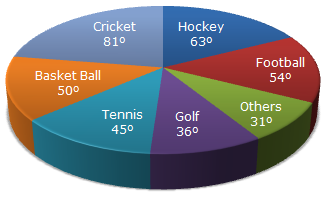
The circle-graph given here shows the spendings of a country on various sports during a particular year. Study the graph carefully and answer the questions given below it.


 Required percentage = Rs.

| 3. |
If the total amount spent on sports during the year be Rs. 1,80,00,000 , the amount spent on Basketball exceeds on Tennis by: |
|||||||
|
| 4. |
How much percent less is spent on Football than that on Cricket? |
|||||||||||||||||||
|
| 5. |
If the total amount spent on sports during the year was Rs. 2 crores, the amount spent on Cricket and Hockey together was: |
|||||||
|