
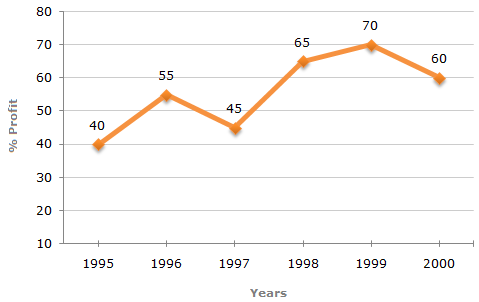
The following line graph gives the annual percent profit earned by a Company during the period 1995 - 2000.
Percent Profit Earned by a Company Over the Years.
| %Profit = | Income - Expenditure | x 100 |
| Expenditure |
| 1. |
If the expenditures in 1996 and 1999 are equal, then the approximate ratio of the income in 1996 and 1999 respectively is? |
|||||||
|


| 2. |
If the income in 1998 was Rs. 264 crores, what was the expenditure in 1998? |
|||||||
|
 Expenditure in 1998 = Rs. 160 crores.
| 3. |
In which year is the expenditure minimum? |
|||||||
|
| 4. |
If the profit in 1999 was Rs. 4 crores, what was the profit in 2000? |
|||||||
|