
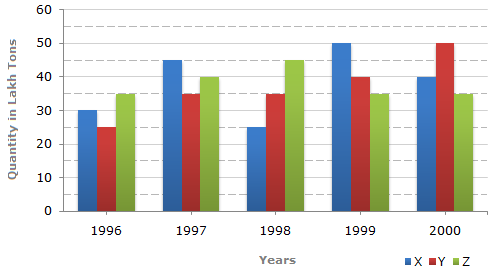
The bar graph given below shows the data of the production of paper (in lakh tonnes) by three different companies X, Y and Z over the years.
Production of Paper (in lakh tonnes) by Three Companies X, Y and Z over the Years.
| 6. |
What is the difference between the production of Company Z in 1998 and Company Y in 1996? |
|||||||
|