
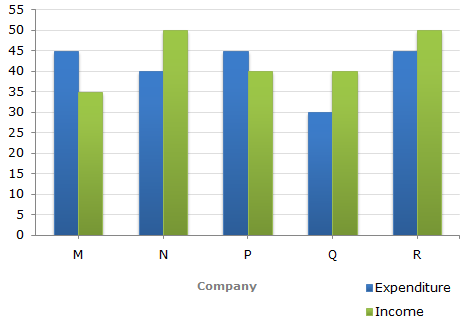
The following bar graph shows the Income and Expenditures (in million US $) of five companies in the year 2001. The percent profit or loss of a company is given by
| % Profit/Loss = | Income - Expenditure | x 100 |
| Expenditure |
Income and Expenditure (in million US $) of five companies in the year 2001.
| 1. |
The companies M and N together had a percentage of profit/loss of? |
|||||||
|
 Percent Profit/Loss of companies M and N together

| 2. |
In 2001, what was the approximate percentage of profit/loss of all the five Companies taken together? |
|||||||
|

![]](/_files/images/data-interpretation/common/15-sym-cbracket-h1.gif)
 5%.
5%.| 4. |
For Company R, if the expenditure had increased by 20% in year 2001 from year 2000 and the company had earned profit of 10% in 2000, what was the Company's income in 2000 (in million US $)? |
|||||||
|
 x = 37.5.
 %Profit in 2000 = 10%]
| 5. |
If the income of Company Q in 2001 was 10% more than its income in 2000 and the Company had earned a profit of 20% in 2000, then its expenditure in 2000 (in million US $) was? |
|||||||
|