Analysis of the graph:
We shall first determine the number of cars of each model produced by the Company during the two years:
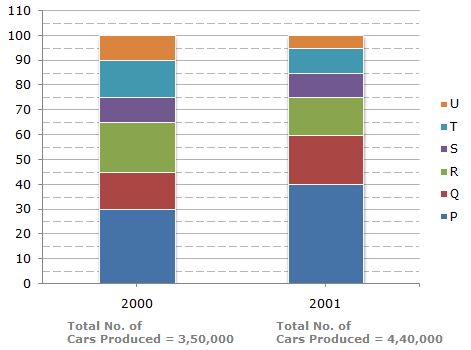
In 2000 : Total number of cars produced = 3,50,000.
P = (30 - 0)% of 3,50,000 = 30% of 3,50,000 = 1,05,000.
Q = (45 - 30)% of 3,50,000 = 15% of 3,50,000 = 52,500.
R = (65 - 45)% of 3,50,000 = 20% of 3,50,000 = 70,000.
S = (75 - 65)% of 3,50,000 = 10% of 3,50,000 = 35,000.
T = (90 - 75)% of 3,50,000 = 15% of 3,50,000 = 52,500.
U = (100 - 90)% of 3,50,000 = 10% of 3,50,000 = 35,000.
In 2001 : Total number of cars produced = 4,40,000.
P = (40 - 0)% of 4,40,000 = 40% of 4,40,000 = 1,76,000.
Q = (60 - 40)% of 4,40,000 = 20% of 4,40,000 = 88,000.
R = (75 - 60)% of 4,40,000 = 15% of 4,40,000 = 66,000.
S = (85 - 75)% of 4,40,000 = 10% of 4,40,000 = 44,000.
T = (95 - 85)% of 4,40,000 = 10% of 4,40,000 = 44,000.
U = (100 - 95)% of 4,40,000 = 5% of 4,40,000 = 22,000.
Total number of cars of models P, Q and T manufacture in 2000
= (105000 + 52500 + 52500)
= 2,10,000.

 Required difference = (88000 - 52500) = 35,500.
![]](/_files/images/data-interpretation/common/15-sym-cbracket-h1.gif)